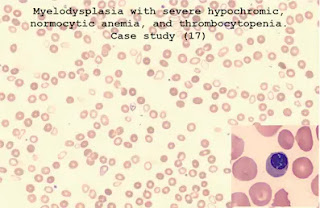
Case study (17)- Myelodysplasia with severe hypochromic, normocytic anemia, and thrombocytopenia.
History and clinical signs and symptoms
A 58-year-old man with known myelodysplasia (diagnosed 3 years before) presented at the outpatient clinic due to fatigue and general weakness.
Laboratory Investigations
1. Hematologic findings
RBC:2.48 X 10⁶/μL (4-5.5 X 10⁶/μL)
HGB: 62 g/dL (120-174 g/dL)
HCT: 21.8 % (36-52%)
MCV: 88.0 fL (76–96 fL)
MCH: 25.2 pg (27-32 pg)
MCHC: 286 g/L (300-350 g/L)
RDWsd:72.6 fL (20-42 fL)
RDWcv: 21.8 % (0-16 %)
WBC: 3.24 X10³/ μL (5–10 X 103/ μL)
Neutrophils: 2.04 X 10³/μL (2-7.5 X 10³/μL)
Lymphocytes: 0.74 X 10³/μL (1.08–3.17 X 10³/μL)
Monocytes: 0.45 X 10³/μL (0.15-0.7 X 10³/μL)
Eosinophils: 0.00 X 10³/μL (0-0.5 X 10³/μL)
Basophils: 0.01 X 10³/μL (0-0.15 X 10³/μL)
Neutrophils %: 63.0 % (40-75 %)
Lymphocytes %: 22.8 % (14.76-45.4 %)
Monocytes %: 13.8 % (3-7 %)
Eosinophils %: 0.0 % (0-5 %)
Basophils %: 0.4 % (0-1.5 %)
PLT: 35 X 103/μL (150-400 X 103/μL)
Warning
Flags ID, Morphological Flags G, Interpretive Flags Anemia ?, Hypochromic ?,
Thrombocytopenia ?, Microcytic PLT?
Interpretation
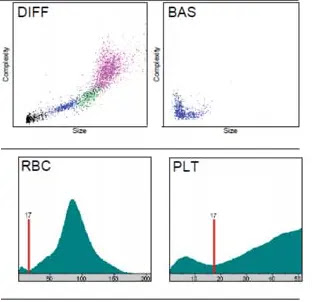
The WBC differential and basophil scattergrams are clearly determined. However, the neutrophils and monocytes populations are not distinguished clearly on the WBC differential scattergram (warning Flag ”D”).
The WBC count indicates a mild leukopenia with lymphopenia and relative monocytosis (see interpretive flags).
Flag ”G” suggests immature granulocytes.
The RBC and PLT histograms are abnormally distributed. The Flag “I” warns that the RBC and PLT populations are not separated.
The confluent population (see on PLT histogram) suggests red blood cell fragmentation.
Broadening of RBC histogram and increased RDW values are indicative of heterogeneous size distribution of RBC’s (see flag “anisocytosis”).
Numerical results indicate normocytic hypochromic anemia (decreased HGB, RBC, MCH, HCT) and severe thrombocytopenia.
Due to several warning flags, overlapping populations on the WBC scattergram and histograms a peripheral blood smear should be microscopically evaluated.
Peripheral blood smear
The peripheral blood smear indicates leukopenia. Within the small population of leukocytes, the prevalence of immature leukocytes in different stages of maturity is strikingly high.
There are also remarkable abnormalities in the RBC population, including hypochromasia, anisocytosis, teardrop erythrocytes, and fragmentocytes.
Erythroblasts (nucleated erythrocytes/NRBCs) were also prevalent.
NOTE: Nucleated red blood cells (NRBCs) are resistant to the lyzing procedure during the measurement. Therefore, they are sorted wrongly into the WBC population.
This may increase the detected WBC count. The WBC may be even lower than that provided.
Blasts, immature and abnormal cells cannot be distinguished reliably with the HumaCount 5L system.
2. Other laboratory findings
- Other laboratory results (renal and hepatic function, cardiac status) are not remarkable.
Diagnosis
Myelodysplasia with severe hypochromic, normocytic anemia, and thrombocytopenia.
Disease course
- The patient was transfused and soon his status improved significantly.


Comments
Post a Comment