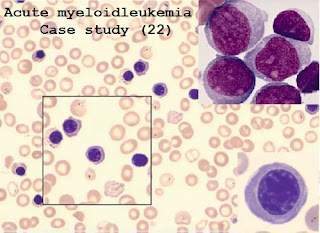
Case study (22)- Acute phase acute myeloid leukemia with severe anemia and thrombocytopenia
History and clinical signs and symptoms
Three months ago, a 60-year-old woman was diagnosed with acute myeloid leukemia.
She was admitted to the hospital for palliative chemotherapy treatment.
Laboratory Investigations
1. Hematologic findings
RBC:2.99 X 10⁶/μL (4-5.5 X 10⁶/μL)
HGB: 88 g/dL (120-174 g/dL)
HCT: 28.8 % (36-52%)
MCV: 96.2 fL (76–96 fL)
MCH: 29.6 pg (27-32 pg)
MCHC: 307 g/L (300-350 g/L)
RDWsd:73.3* fL (20-42 fL)
RDWcv: 21.3 * % (0-16 %)
WBC: 110.0* X103/ μL (5–10 X 103/ μL)
Neutrophils: 57.23 * X 103/μL (2-7.5 X 10³/μL)
Lymphocytes: 29.83* X 103/μL (1.08–3.17 X 10³/μL)
Monocytes: 21.13* X 103/μL (0.15-0.7 X 10³/μL)
Eosinophils: 0.22* X 103/μL (0-0.5 X 10³/μL)
Basophils: 1.65 X 10³/μL (0-0.15 X 10³/μL)
Neutrophils %: 52.0 % (40-75 %)
Lymphocytes %: 27.1 % (14.76-45.4 %)
Monocytes %: 19.2 **% (3-7 %)
Eosinophils %: 0.2 % (0-5 %)
Basophils %: 1.5 % (0-1.5 %)
PLT: 16 X 103/μL (150-400 X 103/μL)
Morphological Flags G, Interpretive Flags Anemia? Macrocytic RBC ?, Anisocytosis? Thrombocytopenia ?.
Interpretation
The WBC differential (DIFF) and basophil (BAS) scattergrams are not well determined. The WBC count is markedly elevated.
(The flag “ * “ means that the measured parameter is not within the linearity range.) The WBC populations are confluent; the populations of neutrophils and monocytes are overlapping.
(Flag “ G “ warns of the elevated percentage of immature leukocytes.) The number and percentage of basophils increased significantly.
The RBC count is remarkably lower than normal (see interpretative flag “anemia”).
The HGB and HCT values are consistent with low RBC counts.
The RBC parameters indicate an elevated MCV. The RBC histogram is abnormally distributed.
These findings indicate that macrophages and heterocytosis (see flags).
Despite the low RBC count, the PLT peak is not increased relative to the RBC peak in the histogram. PLTs are absent.
Due to the morphological signs and the number of confluent white blood cells, the visual assessment of a peripheral blood smear is strongly recommended.
Peripheral blood smear
Consistent with the diagnosis of acute myeloid leukemia, there are immature myeloid cells such as bone marrow cells and promyelocytic cells.
The percentage of monocytes and basophils is also increased (24.4% and 2.6%
respectively).
The prevalence of erythroblasts is dramatically increased (about 22% of total WBC count).
This may cause the WBC count to increase incorrectly. Therefore, the actual WBC count in the peripheral blood sample should be as high as78% of the originally measured WBC.*
* Note: Nucleated red blood cells are resistant to the lysis process during the measurement. Therefore they
are classified falsely into the WBC population. This may increase the detected WBC count. WBC may be even lower than that provided.
Because of their similar size and structure, NRBC mainly counts the number of lymphocytes. Thus analyzer’s lymphocyte count is falsely elevated.
The HumaCount 5L system cannot reliably identify blasts, immature, and abnormal cells.
This also demonstrates that automated results are for rapid screening purposes only.
In the case of abnormal results, especially in the case of warning flags, the importance of microscopic evaluation of peripheral blood smears is very high.
2. Other laboratory findings
- Currently, there is no other remarkable laboratory or physical findings.
Diagnosis
Acute phase acute myeloid leukemia with severe anemia and thrombocytopenia
Disease course
- Anemia and thrombocytopenia were treated by the packed RBCs transfusion and PLT concentrates.
The scheduled course of chemotherapy was continued.


Comments
Post a Comment